Elevate your career with Data Science training in Chandigarh! Our Software Training Institute offers comprehensive courses designed to equip you with in-demand skills and hands-on experience.
Join us and start your journey into the exciting world of data science!
25 +Modules Series
Earn a Certification that demonstrates your expertise.
Advance Level
No previous experience with coding is required
5.5 months
1.5 hours/day class
Flexible Schedule
Online/ Offline both modes of classes available.
Master Data Science and AI with Netmax Technologies! Recognized as the Top Data Science Institute in Chandigarh, our comprehensive course covers everything from foundational data analysis and visualization to advanced machine learning and artificial intelligence. Designed for aspiring data scientists and professionals, you’ll gain hands-on experience using tools like Numpy,Pandas,Matplotlib,, Keras, Tensor Flow , Gemini and ChatGPT preparing you to excel in this fast-growing field
Our Data Science & Machine learning Training in Chandigarh provides hands-on experience, taught by industry experts. The course covers:
NumPy is a Python library for numerical computations, optimized for array operations. Its
foundational for data science due to its efficiency in handling large datasets.
Arrays, Indexing, and Slicing: NumPy arrays are multi-dimensional data structures for
storing numbers. Indexing and slicing allow accessing specific elements or subsets (e.g.,
extracting a row from a matrix).
Mathematical Operations and Broadcasting:
NumPy supports element-wise operations
(e.g., adding two arrays) and broadcasting, which applies operations to arrays of different
shapes efficiently.
Practical:
Perform matrix operations (e.g., dot product) and compute statistics (e.g., mean, standard deviation) on sample datasets to understand array manipulation.
Objectives
Learn to create insightful visualizations and query databases using SQL.
SQL(Structured Query Language) is used to manage and query relational databases, a key skill for accessing structured data.
• Database Concepts and Schema Design: Understand tables, primary keys, and relation
ships (e.g., one-to-many). Schema design ensures efficient data storage. • Queries: SELECT retrieves data, JOIN combines tables, GROUP BY aggregates data (e.g., total sales by region), and subqueries handle complex queries.
• Practical: Query a sample SQLite database (e.g., retail data) to extract insights, such as top-selling products or customer demographics.
Objectives
Understand statistical foundations and introduce machine learning with scikit-learn.
Descriptive statistics summarize data, providing insights into its characteristics.
• Mean, Median, Mode, Variance, Standard Deviation: Mean is the average, median is the
middle value, and mode is the most frequent. Variance and standard deviation measure data spread.
• Probability Distributions: Understand normal, binomial, and Poisson distributions, which
model real-world phenomena like customer arrivals.
• Practical: Compute statistics (e.g., average sales, data variability) on a dataset to summarize its properties
oInferential statistics draw conclusions from data samples.
• Hypothesis Testing, P-values: Test hypotheses (e.g., Is the mean sales different between
regions?) using p-values to assess significance.
• Confidence Intervals: Estimate parameter ranges (e.g., average customer spend) with con
fidence levels.
• Practical: Perform t-tests or chi-square tests on sample data to validate hypotheses
Machine learning enables systems to learn from data for predictions or decisions.
• Supervised vs. Unsupervised Learning: Supervised learning uses labeled data (e.g., pre
dicting house prices), while unsupervised learning finds patterns (e.g., clustering customers).
• Linear Regression, Logistic Regression: Linear regression predicts continuous outcomes
(e.g., prices), while logistic regression predicts categories (e.g., buy/not buy).
• Model Evaluation: Train-test split divides data to assess performance. Cross-validation
ensures robust evaluation.
• Practical: Build and evaluate a regression model using scikit-learn, understanding model fitting and metrics like mean squared error.
• House Price Prediction: Use scikit-learns linear regression to predict house prices (e.g.,
Kaggles Boston Housing dataset). Clean data, select features (e.g., square footage, bed
rooms), train the model, and evaluate performance using metrics like R-squared.
Advanced algorithms address complex data patterns.
• SVMforClassification: SupportVectorMachinesfindoptimalboundariestoseparateclasses
(e.g., spam vs. non-spam emails).
• K-means Clustering: Groups data into clusters based on similarity, useful for customer segmentation.
• Practical: Apply K-means to cluster customer data and SVM to classify data points.
Optimization improves model performance and generalizability.
• Hyperparameter Tuning with GridSearchCV: Test combinations of parameters (e.g., tree
depth) to find the best model configuration.
• Feature Selection and Engineering: Select relevant features and create new ones (e.g.,
combining age and income) to enhance model accuracy.
• Practical: Optimize a models performance using GridSearchCV and feature engineering
techniques
Car Price Prediction: Build a machine learning model (e.g., random forest or gradient
boosting) using a dataset (e.g., Kaggles used car dataset). Preprocess data, engineer features
(e.g., car age), and optimize the model for accurate price predictions
Objectives
Master deeplearning concepts and convolutional neural networks (CNNs) with TensorFlow/Keras.
Deep learning uses neural networks to model complex patterns.
• Neural Networks and Activation Functions: Neural networks consist of layers of nodes
that process data. Activation functions (e.g., ReLU, sigmoid) introduce non-linearity for
complex modeling.
• Backpropagation and Optimization: Backpropagation adjusts weights to minimize errors.
Optimizers (e.g., Adam) update weights efficiently.
• Practical: Build a simple neural network for a regression or classification task using Tensor
Flow/Keras
Advanced neural network techniques improve model performance.
• Building and Training Deep Neural Networks: Stack multiple layers to model complex
data. Train models using epochs and batch sizes.
• Handling Overfitting: Use dropout (randomly disabling nodes) and regularization (penaliz
ing large weights) to prevent overfitting.
• Practical: Train a deep neural network on a tabular dataset, applying techniques to reduce
overfitting
CNNs are specialized for image data, critical for computer vision.
• CNNArchitecture: Convolution layers extract features (e.g., edges), pooling layers reduce
dimensions, and fully connected layers make predictions.
• Image Preprocessing: Normalize pixel values and augment data (e.g., rotate images) to
improve model robustness.
• Practical: Build a CNN for image classification, experimenting with different architectures
Cat-Dog Classification: Use a CNN to classify images of cats and dogs (e.g., Kaggles Cats
vs Dogs dataset). Preprocess images, train the model, and evaluate accuracy, exploring tech
niques like data augmentation
Objectives
Learn NLP techniques and build a chatbot as a capstone project.
NLPFundamentals
NLPenables computers to process and analyze text data.
• Text Preprocessing: Tokenization splits text into words, stemming/lemmatization reduces words to their root forms, and stop-word removal eliminates common words (e.g., the).
• BagofWords,TF-IDF: Bagofwordsrepresents text as word counts, while TF-IDF weights
words by importance, useful for text classification.
• Practical: Process and analyze text data (e.g., reviews) to create feature representations
Sentiment analysis classifies text as positive, negative, or neutral.
• Word Embeddings: Word2Vec and GloVe represent words as vectors capturing semantic
relationships (e.g., king is close to queen).
• Sentiment Classification with LSTM: Long Short-Term Memory networks model sequen
tial data, ideal for text analysis.
• Practical: Build a sentiment analysis model using LSTM to classify text data
Chatbots simulate human conversation using NLP techniques.
• Sequence-to-Sequence Models: These models map input text to output responses, suitable
for dialogue systems.
• Hugging Face Transformers: Leverage pre-trained models (e.g., BERT) for advanced NLP
tasks, fine-tuning for specific applications.
• Practical: Build a simple rule-based or neural chatbot, experimenting with dialogue genera
tion.
Sentiment Analysis: Develop a model to classify movie reviews as positive or negative (e.g.,
IMDb dataset) using LSTM or transformers, evaluating accuracy and F1-score.
• ChatbotBuilding: Create a chatbot (e.g., a customer service bot) using Hugging Face Trans
formers, integrating intents and responses for practical use.


Knowing tools is what separates a trained professional from someone who just watched YouTube tutorials.
Here’s what you’ll get hands-on practice with:


In this project, medical data like age, blood pressure, and cholesterol is analyzed. Then, prediction models help identify heart disease risks. This improves early diagnosis.
Tools used: Python, Pandas, Scikit-learn, Logistic Regression
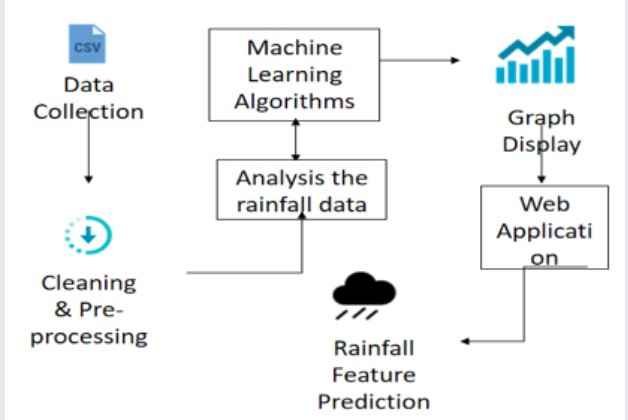
Weather data is collected and cleaned using data science methods. Then models predict rainfall for agriculture and planning needs.
Tools used: Python, Pandas, Time Series Models, Matplotlib

Students analyze car details such as brand, model, mileage, and year. After cleaning the data, models predict the selling price. This is used in online car platforms.
Tools used: Python, Pandas, NumPy, Machine Learning
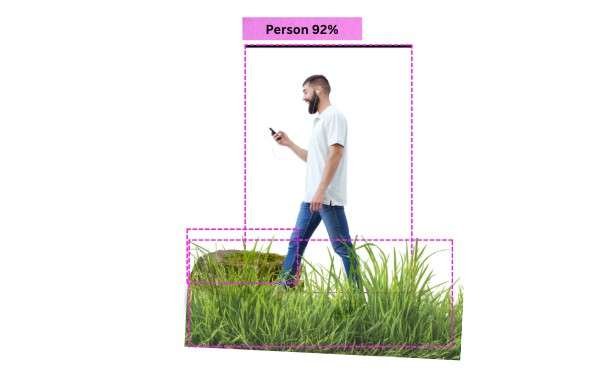
Here, images and videos are analyzed using data science models to detect people and objects in real time for security and automation.
Tools used: Python, OpenCV, YOLO, TensorFlow

Image data is trained using deep learning models to classify cats and dogs, helping students clearly understand computer vision concepts.
Tools used: Python, TensorFlow, Keras, and OpenCV.
First, students collect housing data such as location, size, and price. Then, the data is cleaned and analyzed. After that, machine learning models predict house prices.
Tools used: Python, Pandas, NumPy, Scikit-learn, Matplotlib

Python and data science techniques analyze camera frames to detect motion patterns, helping build smart security monitoring and alert systems.
Tools used: Python, OpenCV, Image Processing
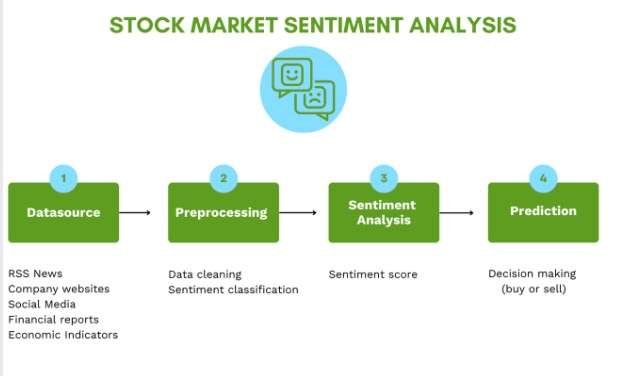
Students analyze text from reviews or social media. Then, the system classifies sentiment as positive, negative, or neutral. This helps companies understand customer feedback.
Tools used: Python, NLP, NLTK, Scikit-learn, TextBlob, Pandas
In this projet, data science techniques help analyze medical text data, improve responses, and organize information for better healthcare support.
Tools used: Python, Gemini API, Natural Language Processing (NLP), Flask
Knowing Stop watching and start building. Learn the tools that separate the experts from the beginners.
Here is the toolkit you will master:

EXCELLENTTrustindex verifies that the original source of the review is Google. I just finished my MERN Stack Web Development course at Netmax Technologies, and I’m really thankful to all the teachers for their amazing support and guidance. They explained everything so clearly and made learning fun with practical examples and projects. This course has really boosted my confidence in web development. I’d definitely recommend Netmax to anyone who wants to learn coding the right way!Trustindex verifies that the original source of the review is Google. Best institute and friendly staff will help you to learn PLC programm which will help you to grow your careerTrustindex verifies that the original source of the review is Google. Institute has good environment and faculty . It has good infrastructure as compared to other institutions for data science in sector 34.Faculty here is helpful to guide students for their future growth.Trustindex verifies that the original source of the review is Google. Nice experience learning data analysisTrustindex verifies that the original source of the review is Google. Good place must comeTrustindex verifies that the original source of the review is Google. The institute provides a well-structured and practical approach to data science. The trainers explain complex topics in a simple way, with hands-on projects that build real skills.Trustindex verifies that the original source of the review is Google. I successfully completed my Cybersecurity training at Netmax Technologies. The training was highly practical, well-structured, and focused on real-world applications. The trainers were knowledgeable and supportive, making complex topics easy to understand. This course has greatly enhanced my skills and given me a strong foundation for my career in cybersecurity. I would highly recommend Netmax Technologies to anyone looking to build expertise in this field
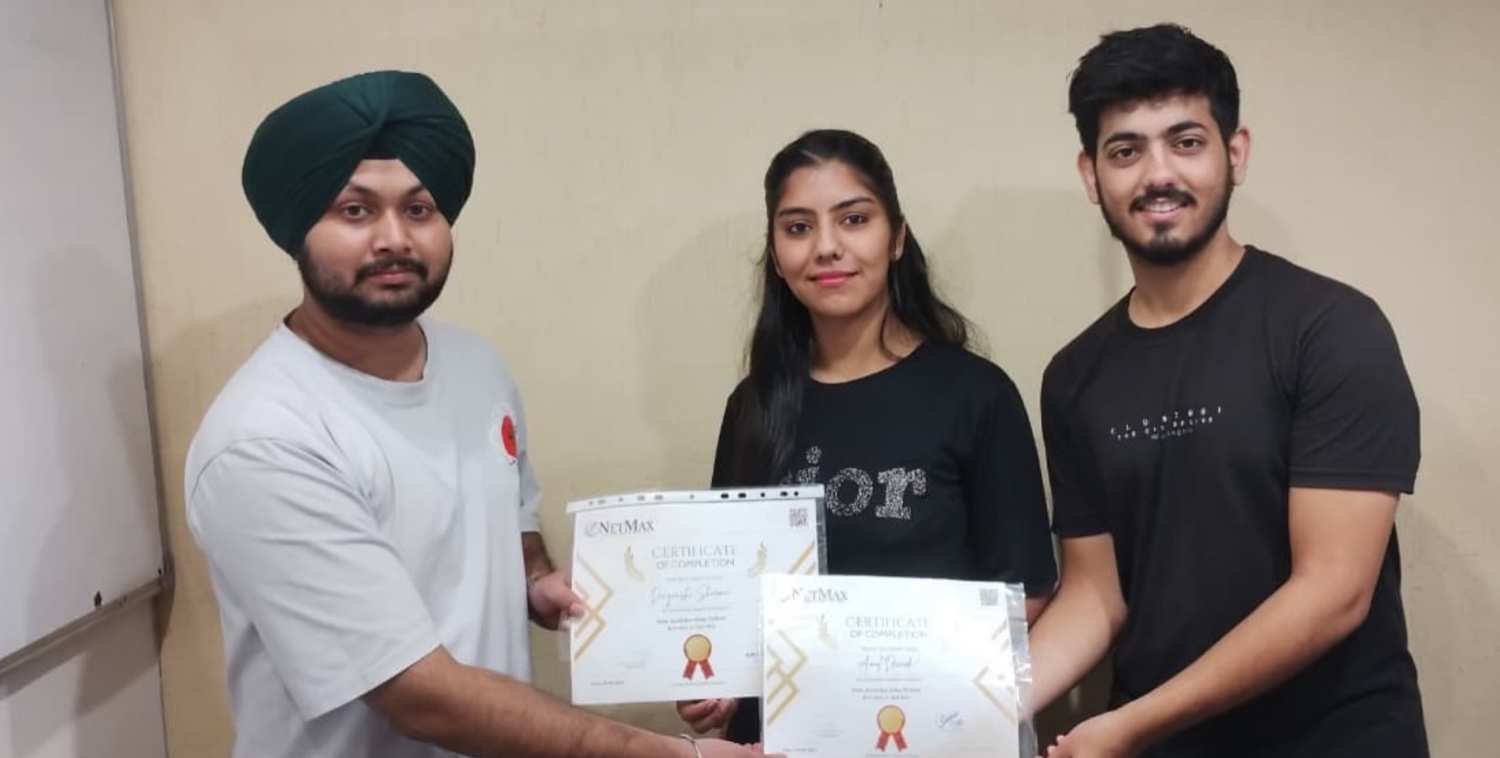
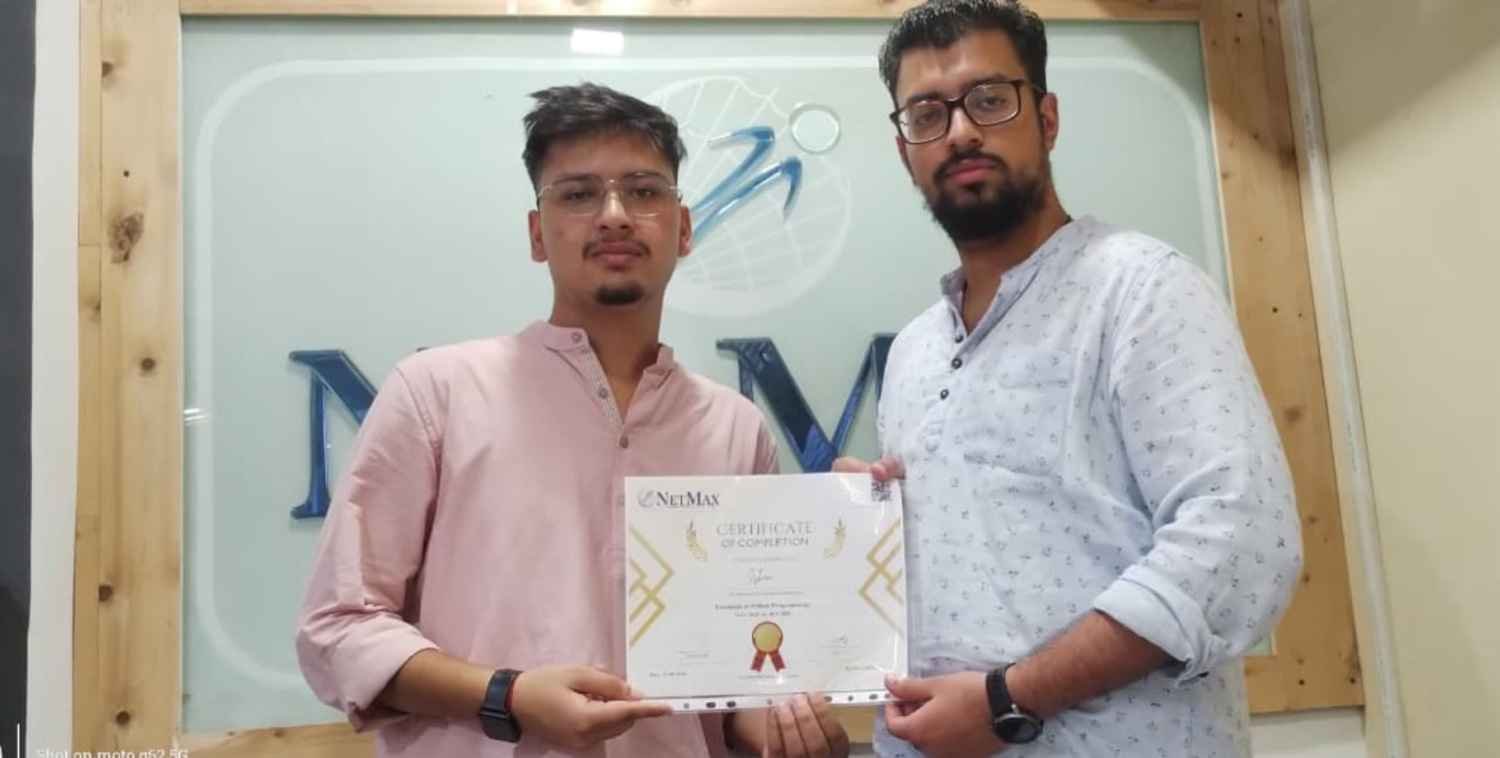
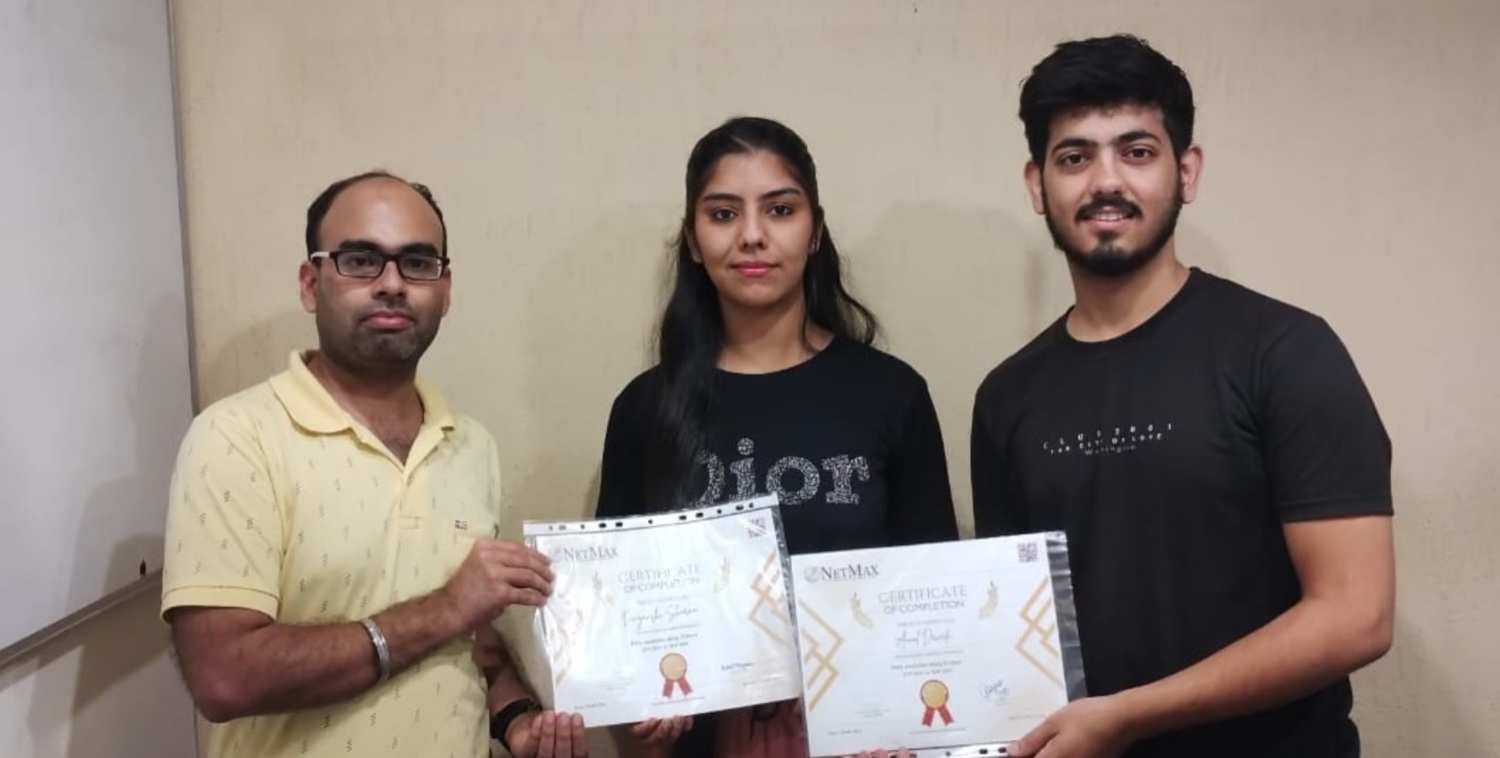
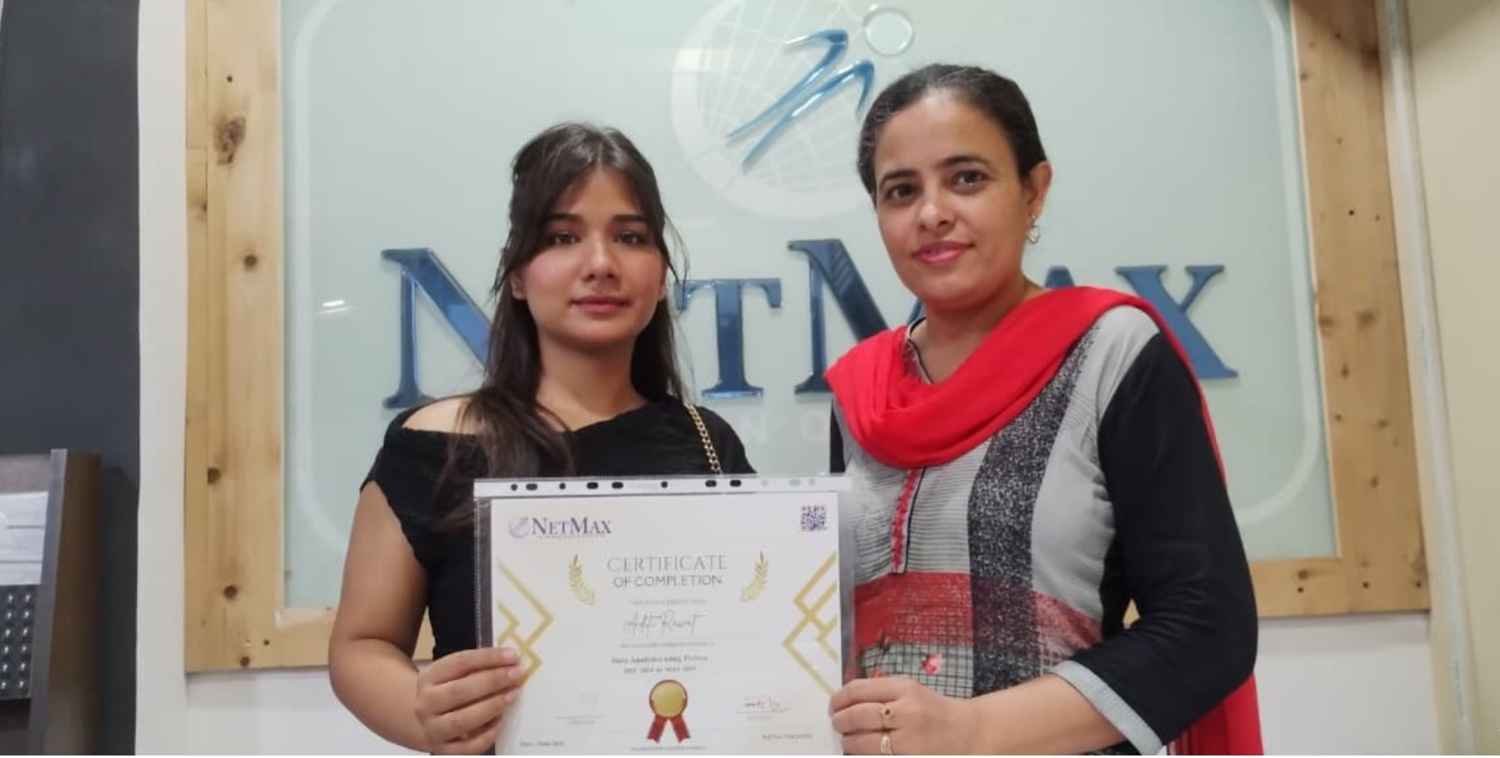
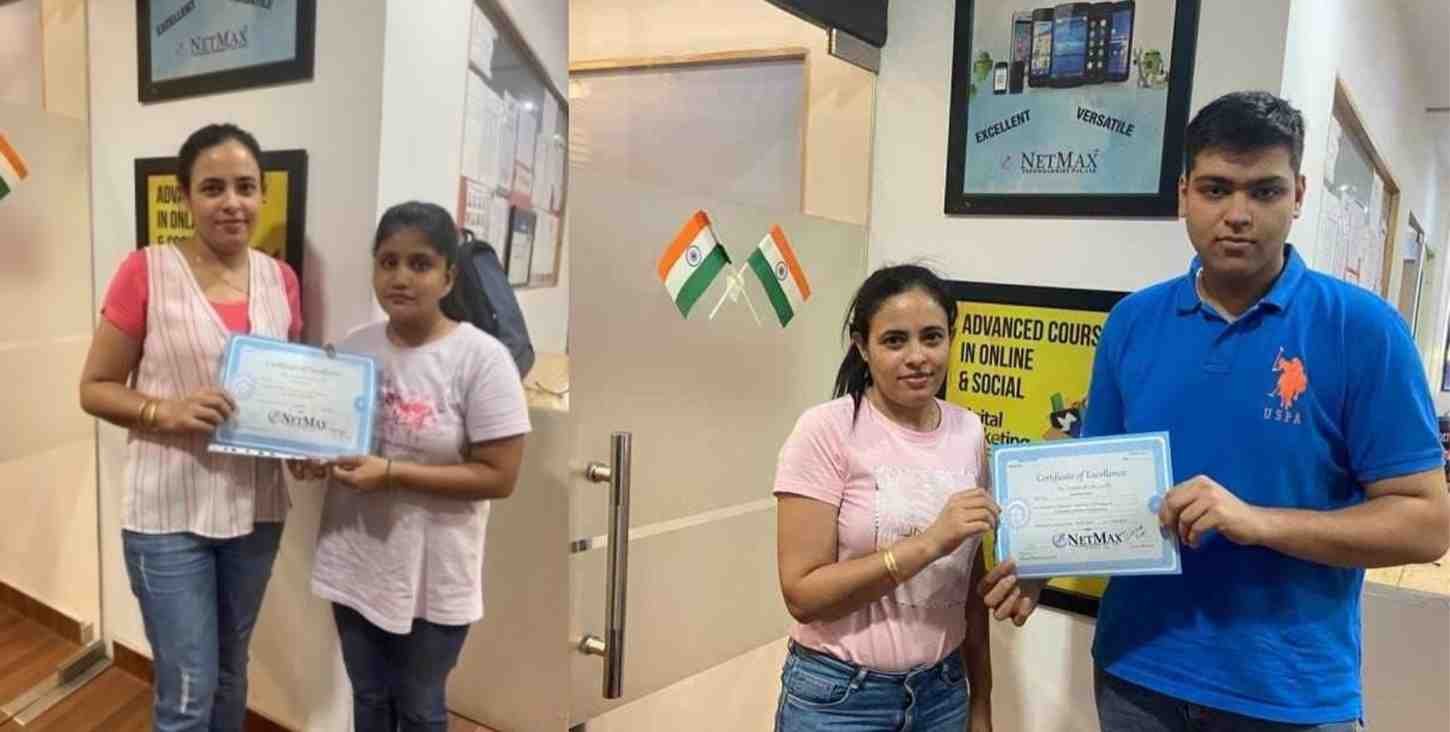
Netmax Industry-oriented Certificate validates the practical skills you have gained during training
Add your Netmax Certificate to your resume and Linkedin profile to stay ahead of the competition
Share your Certification with employers to highlight your capabilities & Job ready Proficiency
Call us on: +91 8699644644 and take your 2 days free Demo classes for Data Science Course
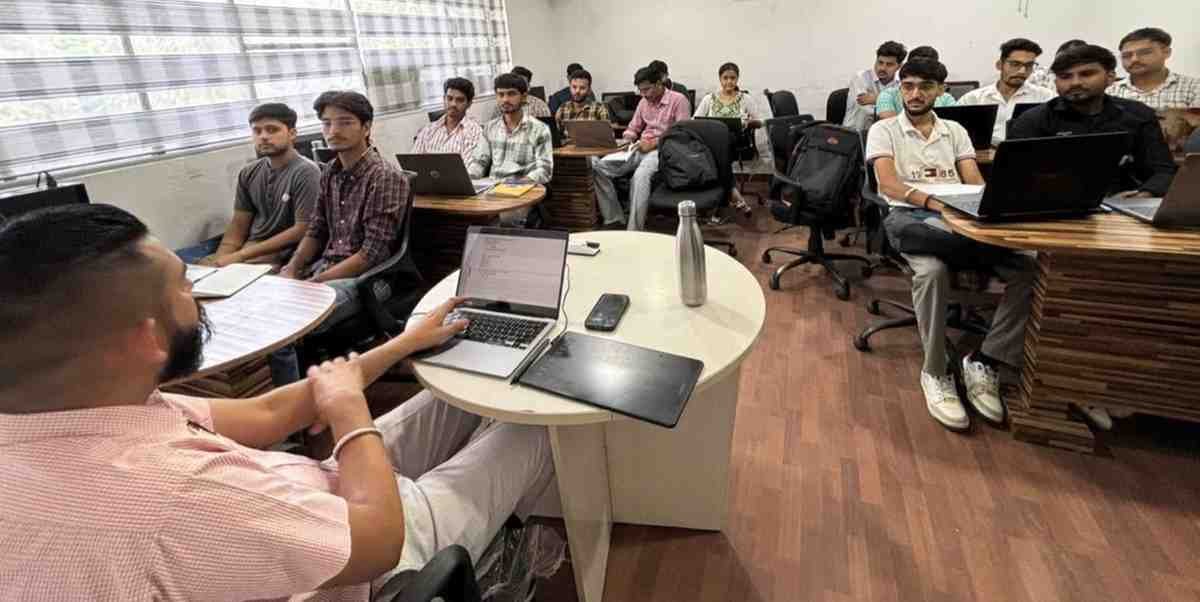
With over 23+ years of expertise, Netmax Technologies is recognized as one of the top Data Science institutes in Chandigarh
Learn Data Science from mentors skilled in Python, analytics, and real industry projects.
Get ready for Data Science certifications with practice questions and expert support.
Study Data Science with flexible timing options for students and working learners.
Practice Data Science using real datasets, coding tasks, and hands-on analytics work.
Learn updated Data Science concepts like statistics, ML models, SQL, and visualization.
Start Data Science Training with job-focused modules offered at affordable pricing.
Join live Data Science expert sessions to clear doubts and understand real workflows.

Improve your Data Science skills with AI tools that guide learning and practice.
Our Data Science Training in Chandigarh offers placement assistance, connecting you with top companies seeking skilled professionals. Graduates from our program have successfully secured positions in leading organizations.
Choose Your Course
Select the course that aligns with your career goals.
Fill the Registration Form
Provide your details and submit the registration form available on our website.
Pay the Course Fee
Make a secure online payment to confirm your enrollment.
Start Learning
Once enrolled, you will receive access to our learning materials, schedules, and project details.

Data Science is the study of mathematics, statistics, machine learning, advanced analytics, and artificial intelligence, to analyze and get insights from vast amounts of data.
Multinational companies like Google, Apple, Microsoft, Amazon, Flipkart, and others are recruiting data scientists to predict customer behavior, develop recommendation systems, identify new opportunities, and more. Data science is a field of study used in every industry, starting from healthcare, finance, banking, insurance, real estate, human resource, medicine, and all others.
Social Media: Sentiment analysis and user behavior modeling enable platforms to understand user preferences, tailor content and combat misinformation.
Sports Analytics: Data science is used to analyze player performance, enhance training regimes, and strategize game plans in various sports.
Marketing: Data science optimizes marketing campaigns, identifies target audiences, and measures the effectiveness of advertising efforts.
Healthcare: Data science aids in disease prediction, drug discovery, and personalized medicine by analyzing patient data and medical records to identify patterns and trends.
Finance: It is used for fraud detection, risk assessment, and algorithmic trading, helping financial institutions make data-driven decisions in a volatile market.
E-commerce: Recommender systems analyze customer behavior to provide personalized product recommendations, enhancing user experience and increasing sales.
According to Glassdoor, The estimated total pay for a Data Science is ₹8,26,169 per year, with an average salary of ₹7,26,169 per year. This number represents the median, which is the midpoint of the ranges from our proprietary Total Pay Estimate model and based on salaries collected from our users.
The course is available for the duration of both 45 days and 3 months including 1.5 hours of classroom training and 1.5 hours of practical assignments.
For this course, there are no particular requirements. However, having a basic understanding of computers and the internet is helpful.
We provide classes both in-person and online. The format that best meets your needs can be selected.
The course covers a wide range of topics, details of which can be found on our website.
Yes, you will receive a certification from our institute after completing the course successfully.
You will gain practical expertise with a range of website strategies and tools through the completion of case studies, real-world projects, and assignments.
Our professors are professionals in the field with years of experience. They bring practical knowledge and real-world insights to the classroom.
You will be able to communicate with teachers and other students in one-on-one mentorship sessions.
Yes, we provide career support by helping in resume building, interview preparation, and job placement assistance.
By going to our website and completing the online registration form, you can register. As an alternative, you can come to our institute to finish the registration procedure.
Completing an application, attending a brief interview, and paying the course price are all part of the admissions process.
Yes, we occasionally give out a variety of discounts. To learn more, please get in touch with our admissions office.