Premier Data Analytics Course in Chandigarh. Stop learning outdated tools. Our industrial program transforms you into a high-paid expert using real-world data infrastructure. You will gain hands-on mastery over the exact tools used in professional boardrooms. We don’t just show you menus; we teach you to
Master the skills to turn data into actionable insights with our Data Analytics Course. Learn data visualization, statistical analysis and build live dashboards.We bridge the gap between simple charts and elite business intelligence.

25+ Modules Series
Earn a Certification that demonstrates your expertise.
Beginner Level
No previous experience with coding is required
4.5 months
1.5 hours/day class
Flexible Schedule
Online/ Offline both modes of classes available.
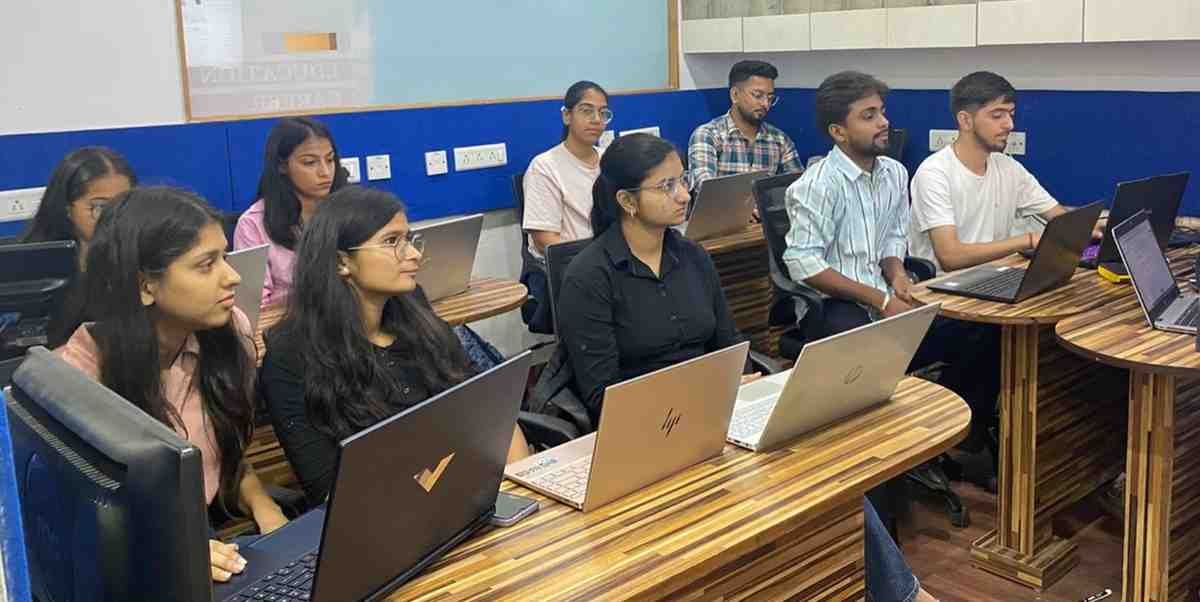
NetMax Technologies offers a comprehensive Data Analytics course in Chandigarh designed to equip students with the skills and knowledge required to excel in the field of data analytics . Our Program includes Python, MySQL, Tableau, PowerBI and Advance Excel.
Most institutes only teach you how to look at data that is already clean. We teach you how to find it, store it and protect it. By learning AI-Assisted Analytics, you gain a massive edge over candidates who only know traditional spreadsheets.
You are the architect of information. To be “job-ready,” you must master the tools that allow data to move from a server to a boardroom dashboard. Our course integrates these critical layers:
• Install and Setup Python and PYcharm IDE
• Variable Types and Input
• Basic Operators
• Decision Making
• Loops and Date & Time
• Numbers and Strings
• Lists,Tuples and Dictionary
• Built-in Functions,User Defined Functions
• Built-In Modules
• File I/O
• Managing Directories
• Exception handling
• Python Slice and Slicing
With over 23 years of expertise, Netmax Technologies is recognized as one of the top Agentic AI training institute in Chandigarh
Learn Agentic AI from mentors skilled in Datascience, analytics, and real industry projects.
Get ready for achieving agentic ai certification with practice questions and expert support.
Practice agentic ai with flexible timing options for students and working learners.
Practice agentic ai using real datasets, ai agents, api and hands-on intelligent work.
Learn updated Data Science with agentic ai concepts like ML models and smart AI prompts.
Start your agentic ai learning journey with job-focused modules offered at affordable pricing.
Join live AI expert sessions to clear doubts and understand ai agents real workflows.

Improve your agentic AI skills with AI tools that guide learning and practice.
Call us on: +91 8699644644 and take your 2 days free Demo classes
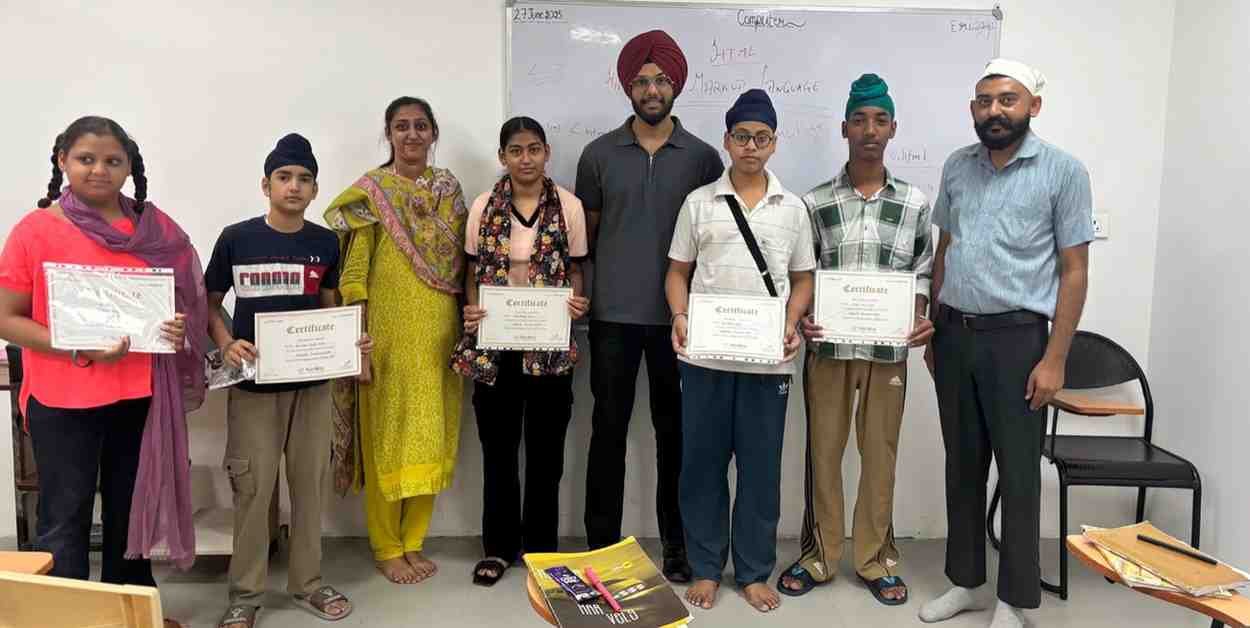
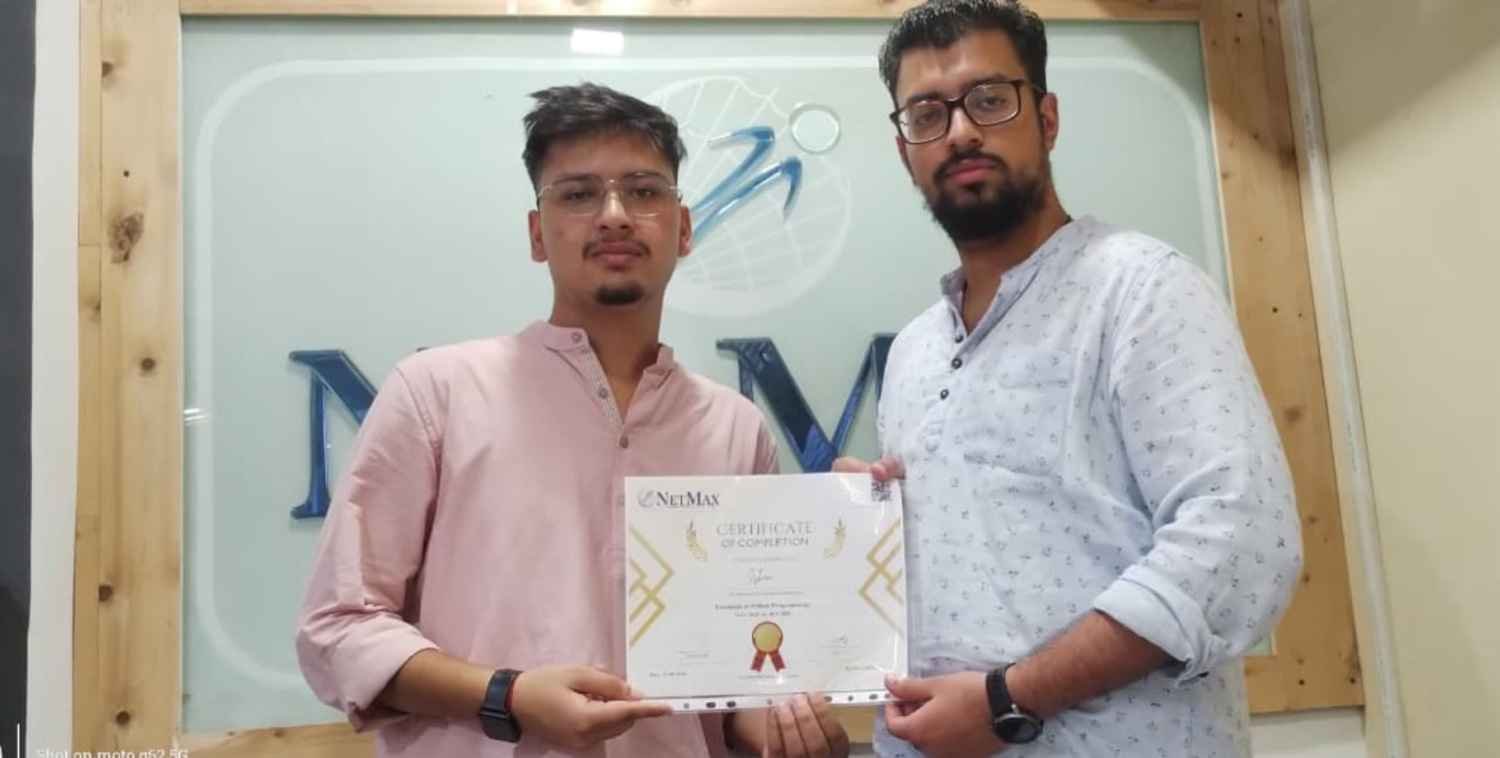
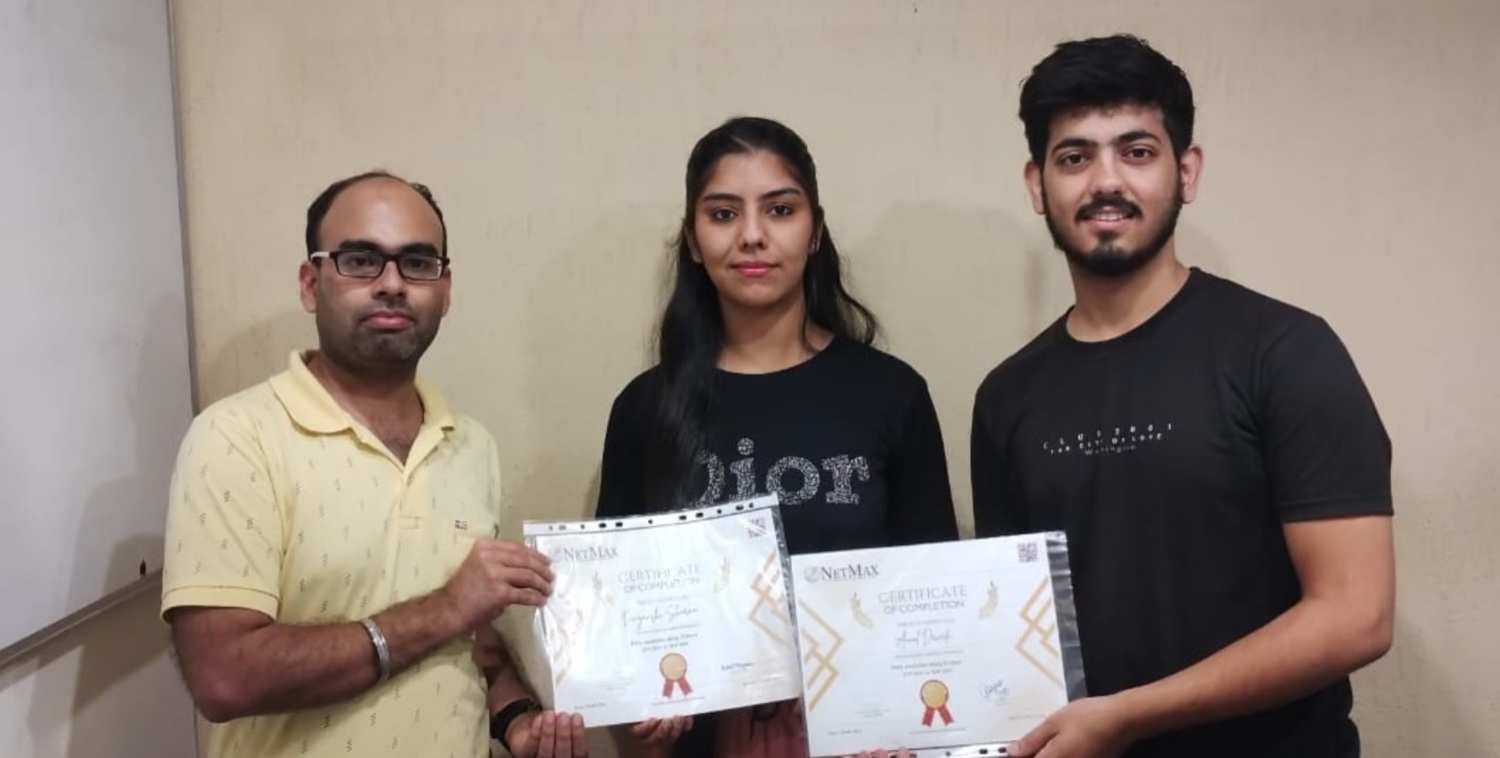
Benefits of Netmax Certificate
Netmax Industry-oriented Certificate validates the practical skills you have gained during training
Add your Netmax Certificate to your resume and Linkedin profile to stay ahead of the competition
Share your Certification with employers to highlight your capabilities & Job ready Proficiency

EXCELLENTTrustindex verifies that the original source of the review is Google. It was a great experience at Netmax Technologies.Trustindex verifies that the original source of the review is Google. I have completed digital marketing courses from netmax I recommend to everyone for join the digital marketing courseTrustindex verifies that the original source of the review is Google. I recently completed my Digital Marketing course at Netmax Technologies, Chandigarh, and it has been one of the best learning experiences of my life. The institute provides a very professional and supportive environment that truly encourages growth. My trainer, Ms. Priyanka Sharma, was absolutely outstanding. She taught every skill with exceptional clarity, patience, and depth — making even the most complex topics feel easy to grasp. What made her teaching truly special was her practical, hands-on approach. She didn't just cover theory; she ensured we worked on real-world projects that prepared us for the actual industry. Beyond just completing the curriculum, she personally invested in our overall development as digital marketing professionals. If you're seriously looking to build a career in digital marketing, Netmax Technologies is the place to be — and having a mentor like Ms. Priyanka Sharma makes all the difference! Skills & Tasks Completed SEO (On-Page & Off-Page) Social Media Marketing Google Ads (PPC Campaigns) Email Marketing Content Marketing & Blogging Google Analytics & Reporting Facebook & Instagram Ads Lead Generation Strategy WordPress Website Setup Live Project ExecutionTrustindex verifies that the original source of the review is Google. I have completed data science and advance excel course here teachers are nice , and made it really easy to learnTrustindex verifies that the original source of the review is Google. I recently completed the Python Programming Course at Metamax Technologies, Chandigarh, and it was a very valuable learning experience. The course helped me build a strong foundation in Python programming, starting from basic concepts such as variables, data types, loops, and functions. One of the most useful aspects of the course was the introduction to Python frameworks and libraries. I gained an understanding of how Python is used in real-world applications and learned about different tools that make development easier and more efficient. The practical exercises and hands-on projects helped me apply what I learned and improve my problem-solving skills. The trainers explained concepts clearly and were always available to answer questions. Their guidance made it easier to understand programming logic and write cleaner code. Overall, I highly recommend Metamax Technologies to anyone who wants to learn Python from the basics and develop a solid understanding of its frameworks and applications. The course has significantly improved my programming knowledge and confidence.Trustindex verifies that the original source of the review is Google. Netmax Technology Pvt.Ltd. offerd a great learning environment for data analytics The internship helped me gain practical experience in data analysis, visualization, and dashboard development using industry-standard-tools.Trustindex verifies that the original source of the review is Google. Did core python course from this institution and my experience was great! my trainer pankaj sir and Ashpreet mam were very thorough and helpful to explain their perticular subjects. I would recommend this to all the people thinking about learning python.Trustindex verifies that the original source of the review is Google. Maine mera python ka course kara tha panjak sir was the teacher he is very nice and friendly and I am happy ki maine netmax se karaTrustindex verifies that the original source of the review is Google. “Excellent institute for learning Python from basic to advanced level. Teachers explain every concept clearly with practical examples.”
After completing the Data Analytics Course in Chandigarh, Netmax offers dedicated placement support.We have tieups with many companies in Tricity. Some of them have been shown here

Data analytics is the process of analyzing raw data to extract meaningful insights, trends, and patterns that can help in decision-making. A Data Analytics course equips individuals with the skills to work with large datasets, perform statistical analyses, and use specialized tools for data visualization and reporting.
Course Content:
According to Glassdoor ,The average salary for Data Analyst is ₹7,19,226 per year in the Chandigarh. The average additional cash compensation for a Data Analyst in the Chandigarh is ₹1,19,226, with a range from ₹1,14,592 – ₹1,23,860. Salaries estimates are based on 9 salaries submitted anonymously to Glassdoor by Data Analyst employees in Chandigarh.
The course is available for the duration of both 45 days and 3 months including 1.5 hours of classroom training and 1.5 hours of practical assignments.
For this course, there are no particular requirements. However, having a basic understanding of computers and the internet is helpful.
We provide classes both in-person and online. The format that best meets your needs can be selected.
The course covers a wide range of topics, details of which can be found on our website.
Yes, you will receive a certification from our institute after completing the course successfully.
You will gain practical expertise with a range of website strategies and tools through the completion of case studies, real-world projects, and assignments.
Our professors are professionals in the field with years of experience. They bring practical knowledge and real-world insights to the classroom.
You will be able to communicate with teachers and other students in one-on-one mentorship sessions.
Yes, we provide career support by helping in resume building, interview preparation, and job placement assistance.
By going to our website and completing the online registration form, you can register. As an alternative, you can come to our institute to finish the registration procedure.
Completing an application, attending a brief interview, and paying the course price are all part of the admissions process.
Yes, we occasionally give out a variety of discounts. To learn more, please get in touch with our admissions office.
After completing a course in web designing, you can pursue job roles such as Data Analysts.
Yes, we offer job placement assistance through our network of industry partners.