Preparing for a data science interview can be daunting, whether you’re a fresher or experienced professional. This guide covers latest data science interview questions and answers to help you succeed.
Here’s a list of the frequently asked data science questions with answers on the technical concept which you can expect to face during an interview.
Data Science is the study of Data to extract insights and knowledge from Structured and Unstructured data by using scientific methods, statistics, maths etc.
| Supervised learning | Unsupervised learning |
| Supervised learning uses labeled data to train models. | Unsupervised learning uses unlabeled data to train models. |
| Supervised learning uses explanatory and response variables. | Unsupervised learning uses explanatory variables only. |
| Find response between explanatory and response variables. | Creates rules to identify relationship between variables. |
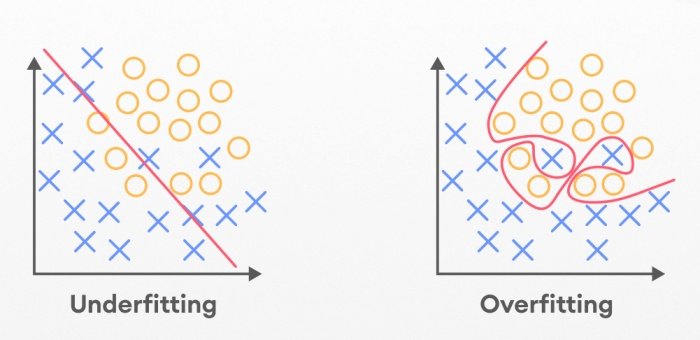
Overfitting occurs when model performance is best on the training data but fails to perform well on unseen data. It can be prevented by using some techniques like cross-validation, regularization, pruning in decision trees.
Your dataset must be loaded into a Python environment as the first step. Use Pandas’ read_csv() or read_excel() functions to import tabular data into a DataFrame when working with CSV or Excel files.
Once loaded, use functions like shape, info, head, and tail to get a high-level understanding of the DataFrame’s contents and structure.
Bias- variance tradeoff includes balancing model complexity and generalization.
High bias (simple models): leads to underfitting
High variance (complex models): leads to overfitting.
Statistics and probability are are two highly related areas of Mathematics that are highly relevant to Data Science. Interviewers often ask questions from these two mathematics fields.
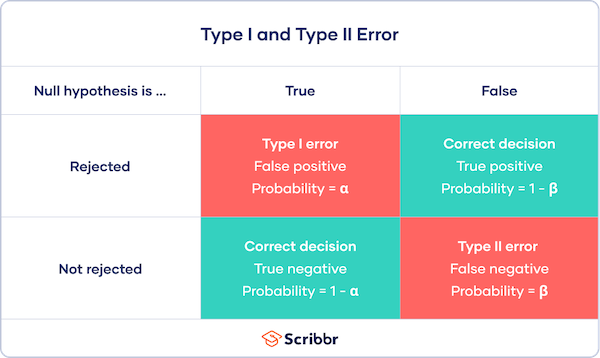
Type1 error is also known as false-positive error. This error occur when null hypothesis is rejected but in actual it’s true.
Type2 error is also known as false-negative error, which occur when there is a failure to reject false value.
Simple random sampling, stratified sampling, cluster sampling, and systematic sampling are common sampling methods.
Difference between correlation and autocorrelation is mentioned below:
| Correlation | Autocorrelation |
| Correlation measures linear relationship between two or more variables. Its values lie from -1 to 1.Negative sign indicates that they are inversely related i.e., if one increases, the other decreases and vice-versa.Positive sign indicates that both are directly related i.e., if one increases or decreases, the other also increases or decreases, respectively.Value 0 means that variables are not related to each other. | Autocorrelation refers to measuring the linear relationship of two or more values of the same variable.Just like correlation, it can be positive or negative.Typically, we use autocorrelation when we have to find the relationship between different observations of the same variable, such as in time series. |
Normal distribution is central concept of data analysis. It is also known as Gaussian distribution. Normal distribution is represented by bell curve when represented in the form of graph as shown in figure below. It is symmetric about mean and shows that a value near means are more likely to occur as compare to values far from mean.
Here’s a list of the frequently asked machine learning questions with answers that you can expect to face during an interview.
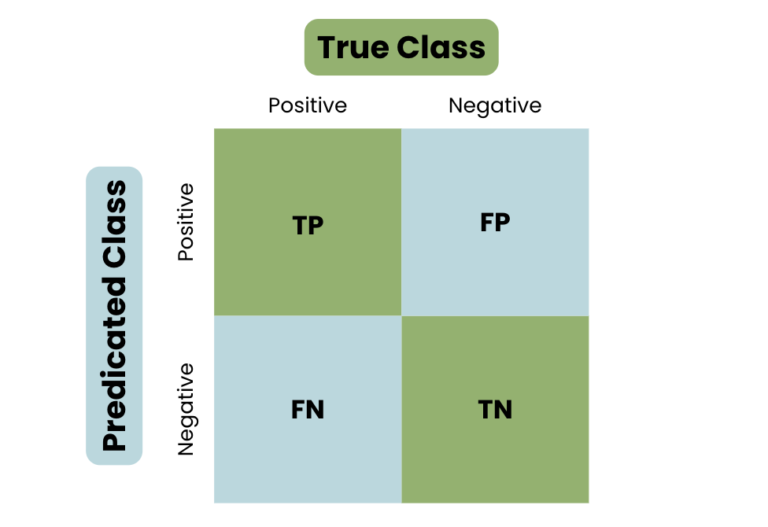
Confusion matrix is used to evaluate performance of a classification algorithm. It basically depicts true positive, true negative , false positive and false negative.
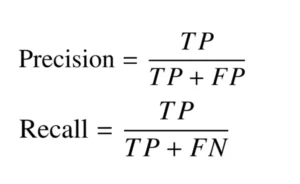
Precision : It measures the proportion of true positive among predicted positives.
Recall : It measures the proportion of true positive identified from actual positive.
Bagging is used to reduce the variance by training multiple models on different subsets of data and then averaging their predictions.
On the other hand, boosting reduces biasness by training model sequentially, each correcting the errors of previous one.
Regularization is a set of techniques used in machine learning to reduce the overfitting. It helps to generalize the model to improve it’s ability or performance.
SVM or Support vector machine is a supervised machine learning algorithm that is used to solve classification and regression problems. This algorithm is used to find hyperplane that best separates the different classes in a feature plane.
Data processing and feature engineering is crucial in Data Science and Data Analytics field. Interviewers repeatedly ask questions from this topic.
Data normalisation scales the data between 0 and 1, to ensure that no single feature govern/dominate the others in the analysis.
Feature selection is the process of choosing subset of relevant features for model construction, which improves model performance and reduce overfitting.
Dimensionally reduction techniques reduces the number of features from the dataset while keeping most of the information.

If we have very large data and few values are missing then we can simply remove the rows containing missing values. Missing values can be filled by using imputations such as mean, median or mode. You can also use algorithms that support missing values directly.
Data augmentation is a technique that improves the machine learning model performance by generating new samples from existing data. Thus, increases the amount of data available for both training as well as testing, and introduces more diversity in the data.
Feature scaling is an essential preprocessing step in machine learning. Its main purpose is to normalize the range of independent variables or features of data. In simpler terms, feature scaling adjusts the values of features to a common scale without distorting differences in the ranges of values. Methods include normalization (min-max scaling) and standardization (z-score normalization).
Data wrangling is the process of cleaning, transforming, and organizing raw data into a usable format for analysis or modeling.
Categorical data can be handled using techniques like one-hot encoding, label encoding, or binary encoding.
Data visualization helps to explore and understand data patterns, detect anomalies, and communicate insights effectively using graphical representations.
Algorithms and Techniques based questions helps the examiner to examine the core concepts of data science. Following mentioned questions are mostly asked interview questions related to algorithms and techniques.
Random forest algorithm is an ensemble learning technique creates multiple decision trees during training and output the mode of the classes or mean predictions for regression problem.
K-means clustering is a unsupervised algorithm that partitions the data into k clusters by minimizing the variance within each cluster.
Gradient descent is an optimization algorithm which is used to train machine learning model as well as neural networks by minimizing errors between predicted and actual values.
Model evaluation is an important part to test algorithm accuracy and other various factor such as overfitting and underfitting. Here are some chief questions asked in an interview.
Common metrics include accuracy, precision, recall, F1 score, ROC-AUC, and confusion matrix.
Common metrics include mean absolute error (MAE), mean squared error (MSE), root mean squared error (RMSE), and R-squared (coefficient of determination).
Cross-entropy loss measures the performance of a classification model whose output is a probability value between 0 and 1, quantifying the difference between predicted and actual probability distributions.
The F1 score is the harmonic mean of precision and recall, useful for imbalanced datasets where you need a balance between precision and recall.
The questions mentioned below helps you to explore your knowledge of cutting-edge methodologies and your ability to implement and tune advanced models for optimal performance.
Deep learning is a subset of machine learning involving neural networks with many layers and is capable of learning hierarchical representations of data.
| CNN | RNN |
| CNNs are feedforward neural networks that use filters and pooling layers. | RNNs are recurring networks that send results back into the network. |
| CNNs have fixed input and output sizes. | RNNs do not have fixed input and output sizes. |
| CNNs are well suited for working with images and video, such as image classification, speech recognition, recommendation systems, and financial forecasting. | RNNs excel at working with sequential data, such as text classification, time series prediction, natural language processing, machine translation, and sentiment analysis. |
| CNNs are incapable of effectively interpreting temporal information. | RNNs are designed for interpreting temporal information. |
NLP is a field of AI focused on the interaction between computers and human language, involving tasks like sentiment analysis, language translation, and text summarization.
Time series analysis is the process of examining data points gathered at regular intervals to uncover trends, seasonal changes, and cyclical patterns, which are then used for making predictions..
It’s a way machines learn, kind of like teaching a pet. When they do something good, you reward them. When they do something bad, you let them know it wasn’t right.
The model that you construct in data science are based on algorithms, so knowledge of algorithm is core concept of data science. Algorithm-specific questions are mentioned below :
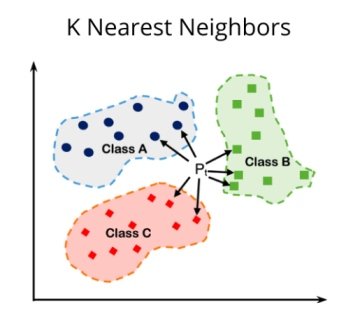
KNN is a simple, instance-based learning algorithm which classifies data points on the basis of majority class of their k-nearest neighbors in the feature space.
A decision tree algorithm splits the data into subsets based on feature values, creating a tree-like model of decisions to predict outcomes.
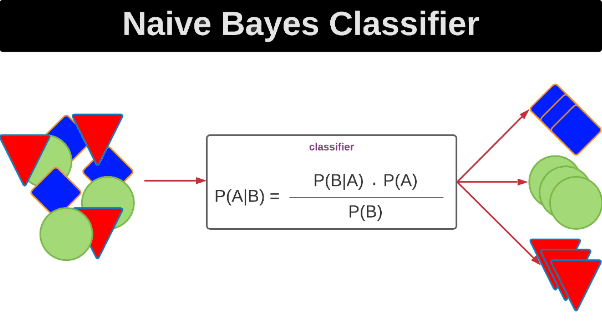
Naive Bayes is a probabilistic classifier based on Bayes’ theorem, assuming independence between features. It is typically used for text classification.
Ensemble learning combines multiple models to improve overall performance by averaging predictions or voting, as seen in methods like bagging, boosting, and stacking.
To implement data science algorithm and testing them in real world is a crucial task. Interviewers frequently ask questions related to data science in practice.
A/B testing is also known as split testing or bucket testing. It is a method for comparing two versions of something to see which is more effective or performs better.
Outliers can be handled by removal, transformation, or using robust statistical methods that are less sensitive to extreme values.
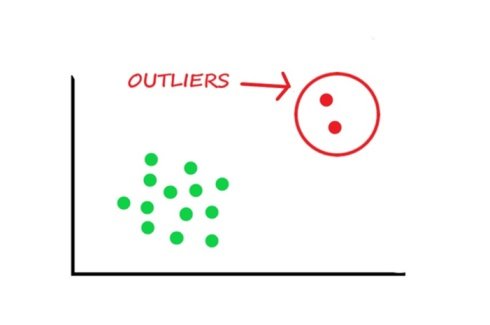
Use statistical techniques like Z-scores and interquartile range (IQR) to identify outliers based on how far they are from the mean or quartiles. You can also plot your data using box plots, scatter plots, or histograms to identify points that are far from the rest of the data.
Data scientists help businesses use data to identify problems, make decisions, and develop solutions. Data scientist use analytical, statistical, and programmable skills to collect large amounts of data, and then use that data to answer questions and make predictions.
Provide a detailed example of a project that you did in the data science class, highlighting the problem, your approach, tools you have used, challenges you faced, and the outcome or impact of your project.
Mention resources like online courses, blogs, research papers, conferences, and active participation in data science communities.
Emphasize skills like critical thinking, problem-solving, programming, statistical knowledge, and the ability to communicate insights effectively.
Outline steps like understanding the data, handling missing values, removing duplicates, transforming features, scaling, and normalizing.
Reproducibility ensures that analyses and results can be consistently replicated, increasing reliability and trust in findings, crucial for collaboration and validation.
Mention practices like thorough data cleaning, validation checks, cross-validation, peer reviews, and documentation.
Use simple language, visual aids, storytelling, focusing on insights and impact rather than technical details.
Mastering the questions and concepts outlined in this guide is essential for excelling in data science interviews. By thoroughly preparing with these common interview questions and their answers, you’ll be well-equipped to showcase your expertise and confidence during the interview process.
If you’re looking to further enhance your data science skills and gain hands-on experience, consider joining Netmax Technologies. As a premier institution in IT training, we offer comprehensive courses ranging from 45 days to 4-6 months, designed to prepare you for real-world challenges and career success. Our experienced instructors and practical training approach ensure that you gain the necessary knowledge and skills to thrive in the competitive field of data science. Enroll today and take the first step towards becoming a proficient data scientist with Netmax Technologies!