
Whether you’re a fresher or an experienced professional, this list of Power BI Interview Questions and Answers will help you prepare efficiently. This guide covers the latest Power BI Interview Questions and Answers, ensuring to help you succeed in interviews.
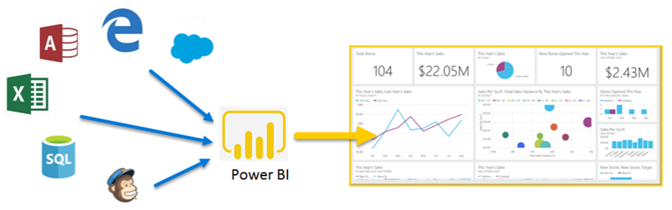
Power BI is a business analytics tool by Microsoft that helps users visualize and share insights. It’s widely used by businesses to create interactive dashboards and reports. Moreover, the platform supports connections to various data sources like Excel, SQL Server, and Google Analytics.
Power BI consists of three main components: Power BI Desktop, Power BI Service, and Power BI Mobile. Power BI Desktop is a Windows application for creating reports and data models. Power BI Service is an online SaaS (Software as a Service) where users can publish and share reports and dashboards. Additionally, Power BI Mobile provides access to dashboards and reports on mobile devices.

Power BI connects to a wide range of data sources, such as, Excel, CSV, SQL Server, Oracle, Azure. Moreover, it integrates with various online services like Google Analytics, Salesforce, and more.
A Power BI report consists of interactive visuals and pages that represent data insights. You can create reports in Power BI Desktop and easily publish them to the Power BI Service.

The Power BI dashboard is a single-page, often called a canvas, that uses visuals from multiple reports and datasets. It offers a consolidated view of the data.
You can import data into Power BI by using the “Get Data” option. You can select from various data sources like Excel, SQL Server, web, etc., and then load the data into Power BI Desktop.
Power Query helps you to clean and prepare your data across a wide variety of sources. It is used for data transformation and preparation in Power BI.

Data can be cleaned in Power BI using Power Query Editor, where you can perform tasks like removing duplicates, filtering rows, changing data types, splitting columns, and more.
In Power BI, data can be refreshed by clicking the “Refresh” button. In Power BI Service, you can schedule automatic refreshes or refresh the dataset manually.
A data model in Power BI is a collection of tables, relationships, and calculations that define how data is connected and how calculations should be performed.
Relationships between tables in Power BI can be created by dragging and dropping fields between tables in the “Model” view. You can also specify the relationship type and cardinality.
Calculated columns are columns created using DAX formulas that are added to tables in your data model. They are used to perform row-level calculations.
Measures are calculations used in data analysis. They are created using DAX and are used to perform aggregate calculations such as sums, averages, and counts.
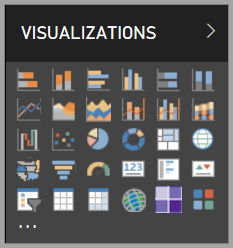
Visuals in Power BI can be created by selecting a visualization type from the “Visualizations” pane and then dragging fields from the “Fields” pane to the visual.
Power BI offers a variety of visuals, including bar charts, line charts, pie charts, scatter plots, maps, tables, matrices, cards, and more. Custom visuals can also be imported.
Custom visuals can be created using tools like Power BI Developer Tools and then imported into Power BI. Alternatively, you can import pre-built custom visuals from the Power BI Visuals Marketplace.
A slicer is a visual that allows users to filter data on the report. Slicers provide an intuitive way to interact with the report by selecting values to filter the data.
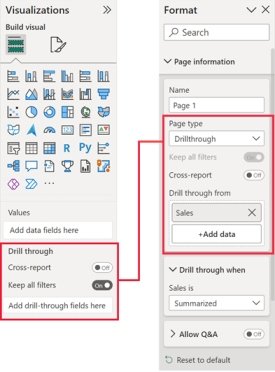
Visuals can be formatted in Power BI by selecting the visual and using the “Format” pane to adjust properties like colors, labels, titles, data labels, and more.
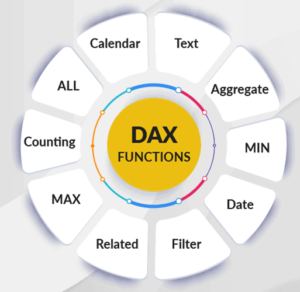
DAX (Data Analysis Expressions) is a formula language used in Power BI for creating calculated columns, measures, and custom tables. It is designed to work with relational data and perform dynamic aggregation.
To create a calculated column using DAX, go to the “Data” view, select a table, and click “New Column.” Then, enter a DAX formula to define the calculated column.
In order to create a measure using DAX, go to the “Data” view, select a table, and click “New Measure.” Then, enter a DAX formula to define the measure.
A calculated column is computed row by row at the time of data load or refresh and stored in the table. A measure is computed on the fly during report rendering and is not stored in the table.
Difference between Calculated Column and Measure in DAX
| Feature | Calculated Column | Measure |
| Computation Time | Computed row by row at the time of data load or refresh. | Computed on the fly during report rendering. |
| Storage | Stored in the table as a column. | Not stored in the table; exists only during report execution. |
| Usage | Useful for row-level calculations that need to be stored and reused. | Used for dynamic calculations based on filter context. |
| Performance | May impact model size as it increases storage requirements. | Efficient in storage but may be slower in execution if complex. |
| Example | Adding a new column for unit price after tax. | Calculating total sales based on current filters. |
Simple DAX formula for a calculated column could be: Total Sales = Sales[Quantity] * Sales[Price].
The CALCULATE function in DAX helps change how filter affects your calculation. It is used to apply custom filters to calculations.
Example: Total Sales for 2023 = CALCULATE(SUM(Sales[SalesAmount]), YEAR(Sales[OrderDate]) = 2023).
The ALL function removes all filters from the specified columns or tables. ALLEXCEPT removes all filters except for the specified columns
Difference between ALL and ALLEXCEPT in DAX
| Feature | ALL | ALLEXCEPT |
| Functionality | Removes all filters from the specified columns or tables. | Removes all filters except for the specified columns. |
| Use Case | Used to clear filters for entire columns or tables, allowing for a complete data view. | Used to clear filters while preserving specific column filters, maintaining context. |
| Filter Context | Ignores all existing filters on the targeted columns/tables. | Maintains filters on the specified columns, removing others. |
| Example | Calculating totals without any filter context. | Calculating totals with specific columns remaining filtered. |
The FILTER function in DAX returns a table that represents a subset of another table or expression. It is used to apply row-level filters.
Example: Filtered Sales = CALCULATE(SUM(Sales[SalesAmount]), FILTER(Sales, Sales[Region] = “North America”)).
Mastering the Power BI Interview Questions and Answers in this guide is essential for excelling in interviews. By thoroughly preparing with these common interview questions and their answers, you’ll be well-equipped to showcase your expertise and confidence during the interview process.
If you’re looking to further enhance your Power BI skills and gain hands-on experience, consider joining Netmax Technologies. As a premier institution in IT training, we offer comprehensive courses ranging from 45 days to 4-6 months, designed to prepare you for real-world challenges and career success. Our experienced instructors and practical training approach ensure that you gain the necessary knowledge and skills to thrive in the competitive field of powerbi. Enroll today and take the first step towards becoming a proficient data scientist with Netmax Technologies!